This page was generated on 2016.07.12 by Auto-Redistrict.
vtd_data.txt (tab-delimited)
vtd_data.dbf (dbase/ESRI)


Bernalillo County
Cibola County
McKinley County
Otero County
Rio Arriba County
Santa Fe County
Socorro County
Taos County
VTD district assignments
vtd_data.txt (tab-delimited)
vtd_data.dbf (dbase/ESRI)
Maps (click to enlarge)
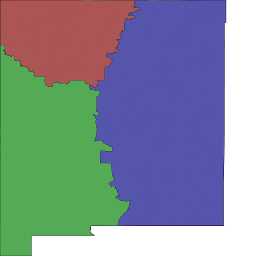
| Districts |  Labeled districts Labeled districts |
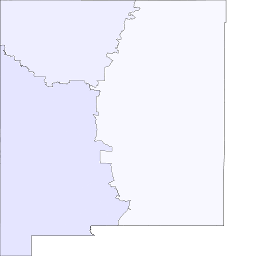
 Unlabeled districts Unlabeled districts |
||
| Geometry |  Population difference Population difference |
 Compactness Compactness |
 Splits Splits |
|
| Fairness - by district |  Partisan vote packing Partisan vote packing |
 Racial vote packing Racial vote packing |
 District vote balance District vote balance |
 District demographics District demographics |
Fairness - by density |  Partisan vote packing Partisan vote packing |
 Racial vote packing Racial vote packing |
 District vote balance District vote balance |
 District demographics District demographics |
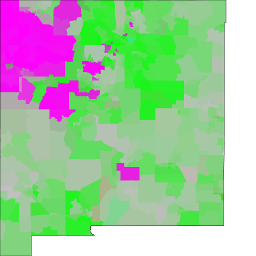
| VTDs |  VTD vote balance VTD vote balance |
 VTD demographics VTD demographics |
 VTD vote balance VTD vote balance(density) |
 VTD demographics VTD demographics(density) |
Seats / votes curve - Vote packing


Summary
| Value | Measure |
|---|---|
| 0.425082546968624 | Compactness (isoperimetric quotient) |
| 0 | Disconnected population (count) |
| 0.882935087 | Population max deviation (%) |
| 0.362183181 | Population mean deviation (%) |
| 9 | County splits |
| 0.000415628 | Seats / vote asymmetry |
| -33.801606352 | Packing/cracking asymmetry (%) |
| 50,140 | Competitiveness (victory margin) |
| 0.236907731 | Disproporionality |
| 0.068274675 | Racial vote dilution |
| 43.294155724 | Efficiency gap (pct) |
| 1.298824672 | Adj. efficiency gap (seats) |
| 0 | Undescribed voters |
| 0.0 | FV Safe D |
| 1.0 | FV Lean D |
| 2.0 | FV Tossup |
| 0.0 | FV Lean R |
| 0.0 | FV Safe R |
| 0.673794700 | Mutation rate (%) |
| 33.000000000 | Elitism (%) |
| 0 | Generation (count) |
By party
| Party | Delegates | Pop. vote | Wasted votes | % del | % pop vote |
|---|---|---|---|---|---|
| PRES12_D50 | 3 | 398,923 | 25071 | 1.0 | 0.5335292213784563 |
| PRES12_R50 | 0 | 348,783 | 348783 | 0.0 | 0.46647077862154374 |
By district
| District | Population | Winner | PVI | Vote gap | Wasted votes | FV Safe D | FV Lean D | FV Tossup | FV Lean R | FV Safe R | Pop per seats | Compactness | Area | Paired edge length | Unpaired edge length | PRES12_D50 vote % | PRES12_R50 vote % | PRES12_D50 votes | PRES12_R50 votes | VAP_WHITE % | VAP_BLACK % | VAP_HISPAN % | VAP_ASIAN % | VAP_HAWAII % | VAP_INDIAN % | VAP_MULTI % | VAP_OTHER % | VAP_WHITE pop | VAP_BLACK pop | VAP_HISPAN pop | VAP_ASIAN pop | VAP_HAWAII pop | VAP_INDIAN pop | VAP_MULTI pop | VAP_OTHER pop |
|---|---|---|---|---|---|---|---|---|---|---|---|---|---|---|---|---|---|---|---|---|---|---|---|---|---|---|---|---|---|---|---|---|---|---|---|
| 1 | 690,122 | 1,0, | D+3 | 18433 | 131951 | 0.0 | 0.0 | 1.0 | 0.0 | 0.0 | 690,122 | 0.38449152849732937 | 4.408484433867334E12 | 9002456.3910088 | 4001328.952634668 | 0.5349240813790019 | 0.465075918620998 | 141,167 | 122,734 | 0.500912633 | 0.016649509 | 0.319087252 | 0.019143072 | 0.000706928 | 0.128855993 | 0.012912061 | 0.001732553 | 259,339 | 8,620 | 165,202 | 9,911 | 366 | 66,713 | 6,685 | 897 |
| 2 | 684,975 | 1,0, | D+5 | 24228 | 117231 | 0.0 | 1.0 | 0.0 | 0.0 | 0.0 | 684,975 | 0.4002617385208051 | 8.637488477777099E12 | 1.034530062660328E7 | 8162880.0059409505 | 0.5516672211275174 | 0.4483327788724825 | 129,345 | 105,117 | 0.332692850 | 0.014965284 | 0.545016943 | 0.008630507 | 0.000586442 | 0.086961569 | 0.009441119 | 0.001705286 | 166,221 | 7,477 | 272,303 | 4,312 | 293 | 43,448 | 4,717 | 852 |
| 3 | 684,082 | 1,0, | D+1 | 7479 | 124672 | 0.0 | 0.0 | 1.0 | 0.0 | 0.0 | 684,082 | 0.5106600196631669 | 1.2515165683342098E13 | 1.0511389456389789E7 | 9383746.392947536 | 0.5149974132018946 | 0.48500258679810543 | 128,411 | 120,932 | 0.520476880 | 0.021706926 | 0.408717560 | 0.012870089 | 0.000626970 | 0.022557541 | 0.011354274 | 0.001689761 | 272,288 | 11,356 | 213,821 | 6,733 | 328 | 11,801 | 5,940 | 884 |
By ethnicity
| Ethnicity | Population | Vote dilution | % Wasted votes | Victory margins | Votes | Straight vote descr. rep. | Target seats | Votes for next seat |
|---|---|---|---|---|---|---|---|---|
| VAP_WHITE | 697,848 | 0.929310929 | 0.062318144 | 21,186.451517897 | 339,972.442312553 | 2 | 2 | 112,839 |
| VAP_BLACK | 27,453 | 0.931611518 | 0.062472418 | 831.825386157 | 13,315.082355370 | 0 | 0 | 373,771 |
| VAP_HISPAN | 651,326 | 1.051937795 | 0.070541310 | 22,143.204425060 | 313,904.069657455 | 1 | 1 | 112,824 |
| VAP_ASIAN | 20,956 | 0.954411092 | 0.064001322 | 658.219572741 | 10,284.468456358 | 0 | 0 | 375,216 |
| VAP_HAWAII | 987 | 0.991126939 | 0.066463429 | 31.928235408 | 480.388024324 | 0 | 0 | 384,761 |
| VAP_INDIAN | 121,962 | 1.155545525 | 0.077489083 | 4,650.815266786 | 60,018.973777549 | 0 | 0 | 318,414 |
| VAP_MULTI | 17,342 | 0.973314357 | 0.065268945 | 551.666057313 | 8,452.198158903 | 0 | 0 | 378,442 |
| VAP_OTHER | 2,633 | 1.001907829 | 0.067186379 | 85.889538636 | 1,278.377257489 | 0 | 0 | 384,230 |
| TOTAL | 1,540,507 | 1 | 0.067058443 | 747,706.000000000 | 50,140.000000000 |
Splits
Bernalillo County
Cibola County
McKinley County
Otero County
Rio Arriba County
Santa Fe County
Socorro County
Taos County